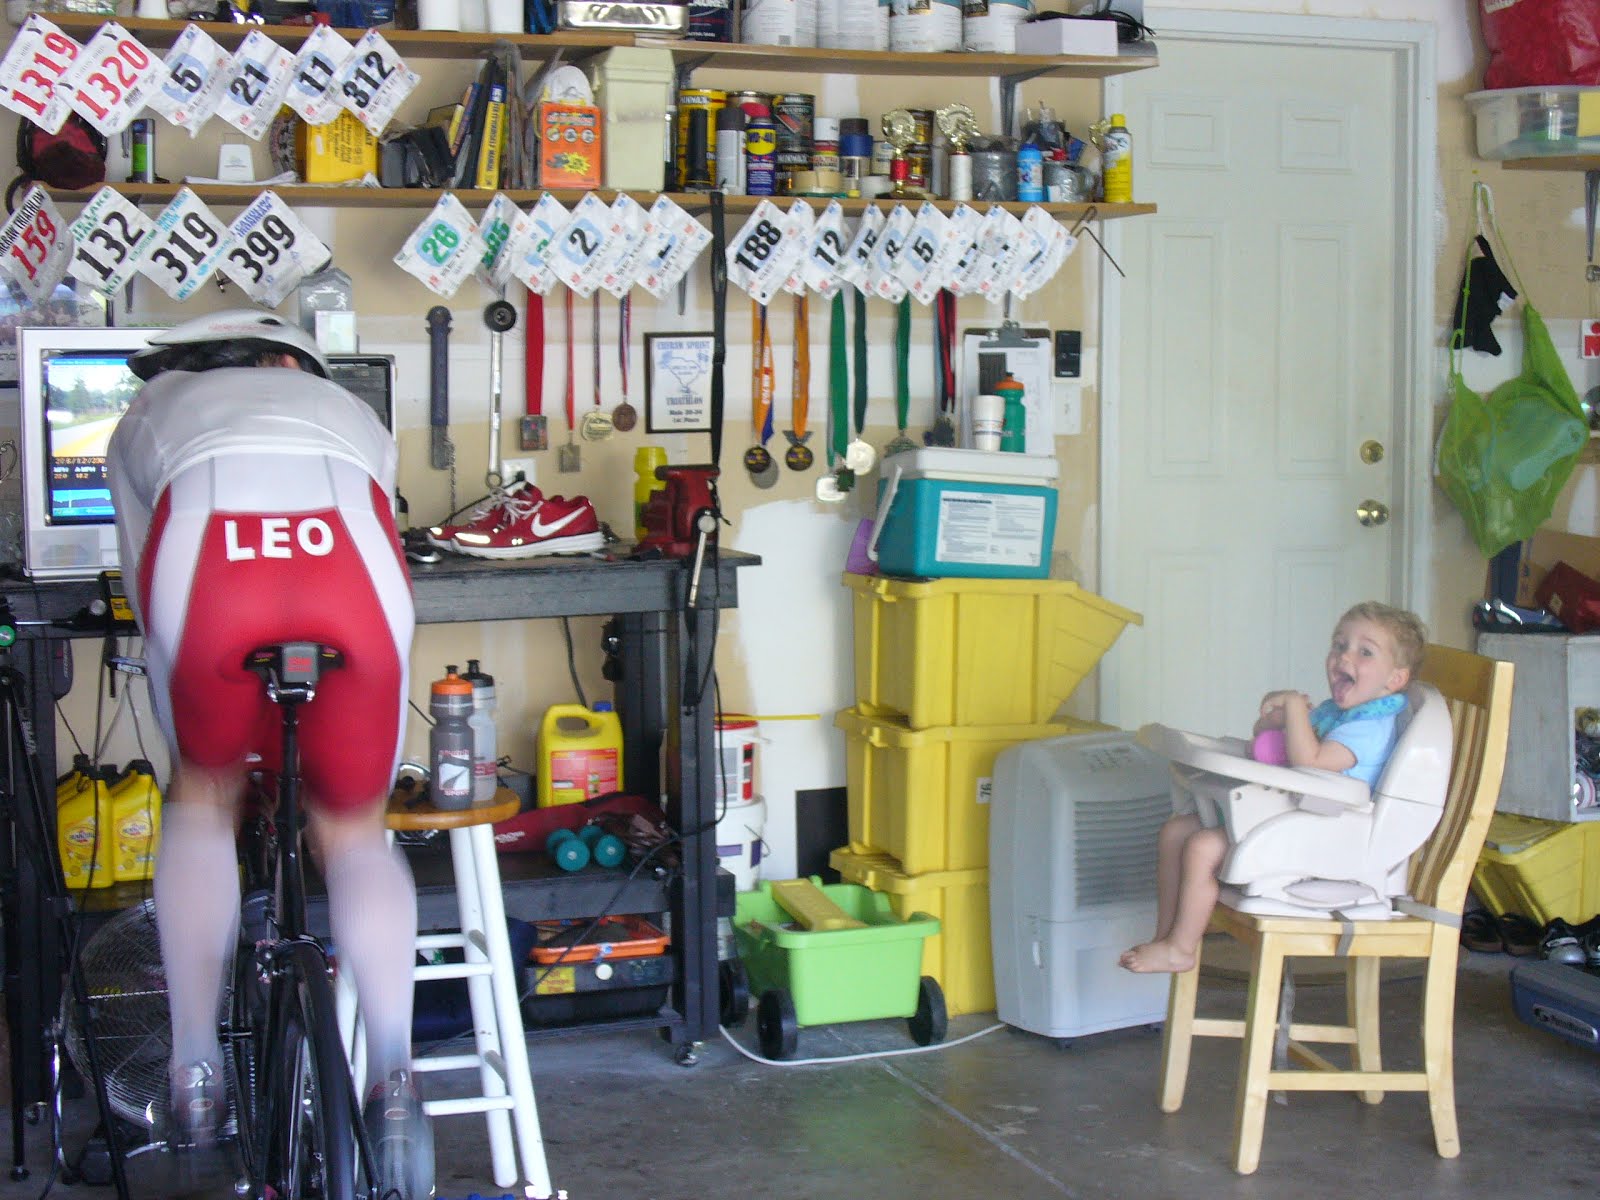
Can you complete/compete at the 140.6 distance w/ only 10 hrs of training per week?

Tuesday, October 2, 2012

Twin Cities Taper 2012 - Part 1

It has been some time since I have posted and thought no better time then now to touch base with the world. The family and I have successfully relocated to St Louis Park, MN and are adjusting to our new life here.

To stay inline with the jist of this blog I thought it appropriate to share my thoughts on the Twin Cities marathon that will take place this Sunday (Oct 7, 2012). Anne and I both ran this race 10 years ago. The goal was for her to qualify for Boston and I was to assist her in this endeavor. She achieved the qualifying part, but never got to run Boston per blowing out her knee, which required micro fracture surgery. That is a post in and of itself. 

Ten years later and here we are just days away from engaging this course again. Kind of exciting. Our training for this event has been subpar to say the least. Again, good content for a later post. 

Being the science guy that I am I will share briefly on how I am going to approach this race and why. 

On Sunday I plan to run 26 plus miles at a pace that could put me in the 2:45 to 2:55 range. With the help of gas exchange and lactate testing I feel confident that this is possible. Think big, dare to fail, and trust in the Lord. I like that triplet. 

Here is some data to chew on for those who like to evaluate numbers and make sense of it all. The data below reflects using gas exchange tesing equipment as pictured here. 


I have become a 'gas exchange' junky since moving to MN. It has become commonplace for me to don the mask (blue mask seen above) and test myself at least one time per week at Life Time Fitness. Again, good material for another post. 

Enter my good friend RQ (Respiratory Quotient). RQ helps validate at any given time how much fat and how much carbohydrate (CHO) the body is using to produce energy. If one sees an RQ value of .7 he or she is metabolizing much more fat then CHO. On the flip side, if one sees an RQ value of 1.0 (or higher) it can be determined that he/she is metabolizing CHO predomintly to create energy. The happy medium of .85 reflects a substrate use of ~50% CHO and 50% fat. Pretty simple stuff that can easily be applied to one wanting to race faster and more efficiently to the person wanting to lose 100 pounds. 

September 21, 2012
Protocol: 4 x 10 min at 9.2 MPH or 6:31 min pace (~2:50 marathon) w/ 2 min recover at 2.5 MPH between each 10 min effort (all at 1% incline).

21-Sep12
RQ HR Fat%
Stage 1 0.88 157 39.57
Stage 2 0.89 162 37.71
Stage 3 0.89 165 37.71
Stage 4 0.88 161 38.33
Averages 0.89 161 38.33


September 28, 2012
Protocol: one less stage per limited time

28-Sep-12 Gas Only
RQ HR Fat%
Stage 1 0.84 155 52.86
Stage 2 0.85 158 50.43
Stage 3 0.84 156 51.64
Averages  0.84 156 51.64


As you can see in just one week there was a SIGNIFICANT change in fat utilization at the same intensity. A 34.7% increase is pretty legit and at an HR that is about 5 beats lower. How could this happen in just 1 week? Was it the taper? Was it the rest? Or was it that I did not eat ice cream like it was my business for a whole week? 

Here is the answer. On September 17 I ran my one and only long run for Twin Cities, which ended up being 23.43 miles. I got lost being the new guy on the block and under estimated the distance around Lake Harriet. Below you will find the nitty gritty of this little adventure:


My slow twitch muscle fibers (STF) were likely still exhausted and recovering being that they were only 4 days post the 23 miler. STF were used predominatly for this 2:30 hr run and one could hypothesize that they were still tired. Therefore, the body relied more on fast twitch fibers (FTF) or their transitional counterparts (Type 2 a, b, x) to work through these 10 min stages. These fibers rely more on CHO or glycogen stores then fat as fuel. Thus, the higher RQ values seen. 

7 days later and the numbers were completely different against the same workload. Legs were more rested and the body was ready to meet the workload with more STF then FTF substrates. Kind of cool to see the value of tapering / resting in just one weeks time. The power of tapering well?

This post is getting a bit long. This Friday (Oct 5) I will add additional evidence that science can certainly help validate your goals. Meaning, one should avoid going into any event blindly. Come back Friday and I will share blood lactate numbers that compliment these findings. I love this stuff. 

Train smart and think big, 
Coach Lance 


Tuesday, February 14, 2012

TRX Endurance Clinic

Those wanting to add a little spice to their current training regimen should take note of this offering. On February 25 I will be conducting the third TRX Strength Clinic at CrossFit Vitality. This clinic will focus on combining two to four dynamic exercises within a 1 to 3 min duration. Muscular endurance and bolstering lactate tolerance will be the cornerstone of this clinic. 

All fitness levels are welcomed. To take part in this clinic please follow the link below: 

Wednesday, February 8, 2012

Where are you?

This past Saturday I was given the pleasure to cheer, observe, and freeze as I observed almost 30 athletes work through non-optimal weather conditions. On this particular day I had each athlete execute two baseline tests that would help solidify where they are from a fitness perspective for February 2012.


As both a physiologist and coach I believe an athlete needs to establish rock solid baseline numbers throughout all stages of the year. The question that arises is what should these tests be?

I am of the opinion that testing the aerobic system is the most logical approach for endurance athletes. I would also say that testing the 'in between energy systems' is also a logical move as well. In my March 2012 CLL Newsletter I will elaborate on a specific test I use to assess this 'gray zone'. To subscribe to this Newsletter simply click on this link: http://visitor.r20.constantcontact.com/d.jsp?llr=g6xhaniab&p=oi&m=1108538023846

For purposes of this post I will consider the predominant pathway used for triathlon; the aerobic energy system. By definition this is the energy system that predominates after approximately 5 min of continuous exercise.

There is an unlimited range of tests one could employ to validate an athletes current fitness level. I opted to use a 7.1 mile loop in Highland Creek Parkway that would be done two times. For the run we used a 3 x 1600 meter run with 2 min walking recovery. In both cases I asked each athlete to take splits of of both laps (bike) and also of each mile (run). I also asked for each athlete to capture Heart Rate recovery post the 14.2 mile TT and post each 1600 meter effort. Keep reading to get a sampling of how one can analyze dig deeper into the data gathered.


Variations to these tests could certainly be made based off of racing goals and experience. Below you will find just a few examples with some questions to get you thinking.

Swim Options

10 x 100 using a set tempo of 1.50 (Finis Tempo Trainer) w/ 1 min recovery
- Can you maintain the stroke rate for the duration of each 100?
- Or do you find that you start to fall of tempo per muscular fatigue or cardiovascular limiters?
- In 2 months do you find you are going faster at the same stroke rate?
- Are you taking fewer strokes per 25 at the same stroke rate?

200 / 800 regression w/ 2 min recovery
- Are you able to throw down a 2 flat 200 yard effort, but find yourself swimming a 10:15 800?
- Are you posting a 3:15 for the 200, but able to throw a 7:55 800?
- Which systems are stronger / more dialed in for each example?

Bike Option

4 x 15 min at 65% of Functional Threshold Power w/ 5 min at 100 watts
- Do you find RPMs dropping significantly from effort one to effort four?
- Do you see a marked change in respiratory rate as you progress through the test?
- How is lactate response changing from one interval to the next? 
- Are you seeing a marked change in HR response from onset to finish?
- Do you find that one leg is contributing significantly more power then the other?

Run Option

60 min at pre-determined Aerobic Threshold pace
- How does your stride rate change within this set time?
- How far are you able to run in this time?
- Does your HR go from 148 bpm to 175 bpm during 60 min?
- Does your HR stay at 158 bpm for the majority of the time?
- How does your form look from minutes 50 to 60 min compared to 0 to 10 min?

As you can see testing must point to answers. These answers help us understand how to best train your weak and strong systems. Without such data we are left to guess, ponder, and hope that the training is progressing as intended. 

I urge each of you to contact your coach and get on his or her schedule today so some rock solid numbers can be collected. I'd also urge each of you to execute field tests much like the ones noted in the Baseline Camp #1 above. 

Lets get dialed in and always be training with purpose! There is no other way to train.